top of page

Q1 2026: A Solid Foundation... with a Shrinking Margin for Error

  • David Halseth
  • 3 days ago
  • 8 min read

Updated: 9 hours ago

For the quarter ending March 31st, 2026.


If you’re looking for a clean read on the economy, the answer is surprisingly straightforward: most indicators still look...pretty good. Growth remains intact, the consumer continues to spend, and inflation - at least for now - has settled into a more manageable range. The notable exception? Government finances, where rising interest costs and structural spending continue to quietly erode flexibility. Of course, stability in markets rarely lasts uninterrupted. Geopolitical tensions, particularly in energy-sensitive regions, serve as a reminder that inflation can reaccelerate quickly when supply shocks enter the picture.


Markets reflected this mixed backdrop in Q1. Equities stumbled, finishing down roughly 4% before a last-minute rally spared a worse outcome. Fixed income offered little relief, posting another disappointing quarter as higher rates continued to weigh on returns.


Meanwhile, beneath the headlines, several longer-term trends remain firmly in place. Private credit continues to deliver consistent income, offering a meaningful yield premium over traditional investment grade bonds. At the same time, large institutions are increasingly incorporating private markets into defined contribution plans—an evolution that raises both opportunity and important structural questions.


And finally, one structural shift worth noting: the U.S. is now a net energy exporter, fundamentally changing how global shocks impact the domestic economy.


Highlights

  • Q4 GDP revised downward to 0.7% (most blame falls on the government shutdown)

  • Inflation moderating - 2.4% - led by falling shelter costs

  • Unemployment at 4.4%

  • "Mandatory/non-discretionary" spending now 75% of federal budget


  • U.S. equities declined ~4% in Q1, despite a late-March rebound

  • Technology down 9.4% for the quarter, but still up 31.5% over the past year

  • Small caps now leading large over the past year


  • Domestic bonds down 5 bps in Q1

  • Short term bonds rose 30 bps for the quarter and 3.8% over the past year

  • Long term bonds down 40 bps for the quarter and up 50 bps over the past year


  • Commodities increased an outstanding 24% in Q1

  • Infrastructure up 11% in Q1

  • Hedge strategies quietly rose just under 2% in Q1

  • Private credit continues to deliver ~300–400 bps yield premium over IG bonds


Inflation Components


Shelter inflation - the heavyweight of CPI - is finally easing, helping pull headline inflation down toward the mid-2% range. A welcome shift after doing most of the heavy lifting over the past two years. However, before anyone declares victory, expectations are already resetting, with economists forecasting inflation to drift back toward ~3.5% by year-end.


Inflation, it seems, doesn’t disappear - it rotates across categories. Bottom line: progress is real, but the path forward remains uneven and far from settled.
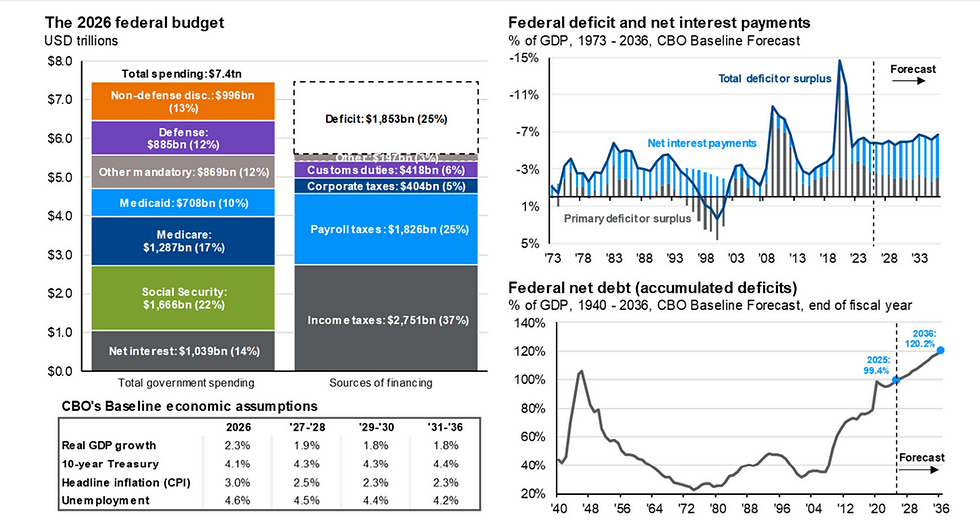

Source: BLS, FactSet, J.P. Morgan Asset Management. Contributions mirror the BLS methodology on Table 7 of the CPI report. Values may not sum to headline CPI figures due to rounding and underlying calculations. “Shelter” includes owners’ equivalent rent, rent of primary residence and home insurance. “Food at home” includes alcoholic beverages. Headline and core PCE deflator inflation shown are based on seasonally adjusted data due to data availability. Official October 2025 data unavailable due to government shutdown and data shown are J.P. Morgan Asset Management estimates. Guide to the Markets – U.S. Data as of March 31, 2026.

Federal Finances


Net interest expense has surged, from roughly 5% of federal spending prior to 2021 to 14% today. That’s a dramatic shift in a very short period of time, and it’s not slowing down.


At the same time, “mandatory” spending now accounts for roughly 75% of the federal budget, leaving limited room for discretionary decisions. Translation: most of the budget is effectively on autopilot, while the fastest-growing expenses are seemingly untouchable.


Flexibility is shrinking, and increasingly, the math - not policy - is in control.


Source: BEA, CBO, Treasury Department, J.P. Morgan Asset Management; (Left) Numbers may not sum to 100% due to rounding; (Top and bottom right) BEA, Treasury Department. Estimates are from the Congressional Budget Office (CBO) February 2026 An Update to the Budget Outlook, 2026 to 2036. “Other” spending includes, but is not limited to, health insurance subsidies, income security and federal civilian and military retirement. Years shown are fiscal years. Forecasts are not a reliable indicator of future performance. Forecasts, projections and other forward-looking statements are based upon current beliefs and expectations. They are for illustrative purposes only and serve as an indication of what may occur. Given the inherent uncertainties and risks associated with forecasts, projections or other forward-looking statements, actual events, results or performance may differ materially from those reflected or contemplated. Guide to the Markets – U.S. Data are as of March 31, 2026.

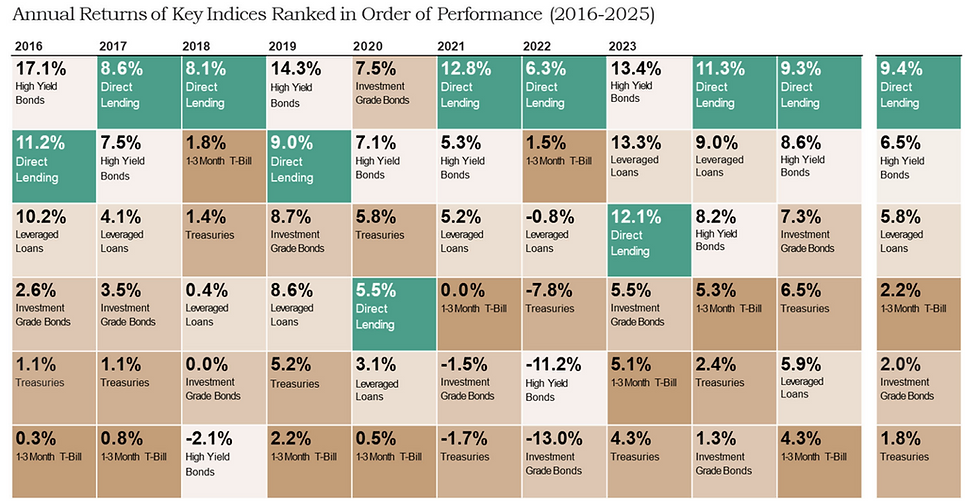
Direct Lending: Performance in Context


Despite the steady drumbeat that private credit is “cracking,” the data tells a different story. Direct lending has delivered consistent, competitive returns - most often outperforming traditional fixed income.


Today, yields near ~9.5% stand in stark contrast to roughly ~4% for the broad U.S. bond market. Even more notable, long-term loss rates have remained below 1%, with recoveries around 50%.


Bottom line: for investors seeking income with discipline, semi-liquid private credit continues to look less like a risk and more like a solution.


Source: Blackstone, Morningstar, Cliffwater, as of December 31, 2025. Represents the annual returns for the respective calendar year, ranked in order of performance. The asset classes presented are based on the following indices: Cliffwater Direct Lending Index for Direct Lending, Bloomberg U.S. Corporate High Yield Index for High Yield Bonds, Bloomberg U.S. Aggregate Bond Index for Investment Grade Bonds, Morningstar LSTA US Leveraged Loan Index for Leveraged Loans, Bloomberg U.S. Intermediate Treasury Index for Treasuries, Bloomberg U.S. Treasury Bill 1-3 Month Index for 1-3 Month T-Bill. Past performance does not predict future returns. There can be no assurance any alternative asset classes will achieve their objectives or avoid significant losses. The volatility and risk profile of the indices is likely materially different from that of a fund. The indices employ different investment guidelines / criteria than a fund and do not employ leverage; a fund’s holdings and the liquidity of such holdings may differ significantly from securities comprising the indices. The indices aren’t subject to fees / expenses and it may not be possible to invest in the indices. The indices’ performance has not been selected to represent an appropriate benchmark to compare to a fund’s performance, but rather is disclosed to allow for comparison to that of well-known and widely recognized indices. A summary of the investment guidelines for the indices are available upon request. In the case of equity indices, performance of the indices reflects the reinvestment of dividends. The indices are not necessarily the top performing indices in the given asset class and recipients should consider this when the performance of any fund or investment to that of the indices. See “Important Disclosure Information,” including “Index Comparison” and “Index Definition.” | (1) Total return is calculated over the period January 1, 2016 to December 31, 2025.

Private Investments in Retirement Plans


Private markets are making their way into DC plans, with some providers suggesting allocations approaching 20% within TDF structures. The logic is sound - enhanced diversification and higher income potential.


But one question lingers: how does illiquidity behave in a daily-priced, daily-liquid environment during periods of stress? Smoothing works both ways - until it doesn’t.


Bottom line: the opportunity is compelling, but execution, liquidity management, and participant behavior will determine whether this evolution succeeds or fails.


Data as of August 31, 2025. For illustrative purposes only. These illustrative strategic asset allocations depict illustrative weights based on J.P. Morgan’s internal analysis. Diversification and asset allocation do not guarantee investment returns and do not eliminate the risk of loss. Source: From complexity to clarity: A measured approach for evaluating private investments in DC plans, J.P. Morgan Asset Management.

Global Energy Trends


Geopolitical tensions tend to spark the same fear trade - oil spikes, inflation worries, and recession chatter. But structurally, the U.S. is in a very different position today. Back in 2006, fossil fuel imports accounted for roughly 30% of domestic energy needs and about 3% of GDP.


Today, the U.S. is a net exporter, with imports now negative - around -11% of consumption.


Meanwhile, Europe and China remain heavily import-dependent. Bottom line: energy shocks still matter - but far less here than abroad.


Source: Energy Institute, Our World in Data, J.P. Morgan Asset Management. Data are from Energy Institute’s Statistical Review of World Energy 2025. (Left) Fossil fuels include oil, coal and natural gas, as aggregated by the Energy Institute. Analysis assumes zero oil exports for China. (Right) Data aggregated by Our World in Data. Renewables include hydro, wind, solar and biomass fuels. Guide to Alternatives. Data are based on availability as of January 31, 2026.

2025/2026 Retirement Plan Contribution Limits


*FRA is Full Retirement Age for Social Security. Assumes FRA at age 67. 1 Beginning in 2026, the SECURE 2.0 act requires those earning $150,000+ must make their 401(k) catch-up contributions as a Roth contribution. 2 Employer may either match employee’s salary reduction contributions dollar for dollar up to 3% of employee’s compensation or make nonelective contributions equal to 2% of compensation up to the annual compensation limit. IRS Publication 560. 3 Employer contributions may not exceed the annual defined contribution limit or 25% of compensation. Other rules apply for self-employed individuals. IRS Publication 560. 4 HSA catch-up contributions for family include $9,750 if one spouse contributes, and $10,750 if each spouse contributes to their own HSA (and both are age 55+). 5 In calendar years before FRA, benefit reduced $1 for every $2 of earned income above the limit; during year of FRA, benefit reduced $1 for every $3 of earned income in months prior to FRA. Source: IRS.gov; SSA.gov.

2026 Tax Rates


For decedents who die during 2026 (up from 13.99 million in 2025). Source: IRS.gov. The presenter of this slide is not a tax or legal professional. This slide is for informational purposes only and should not be relied on as tax or legal advice. Clients should consult their tax or legal professional before making any tax- or legal-related investment decisions.

Performance - Equities


After a strong run, Q1 delivered a reminder that markets don’t move in straight lines. Domestic equities slipped modestly, with most sectors in the red - technology included - while defensive areas offered little refuge.


International markets were similarly uneven, masking what had been strong trailing one-year returns. In other words, the leaders paused, but didn’t disappear.


Bottom line: short-term volatility has returned, but the longer-term trend still reflects a narrow group of winners carrying much of the load.


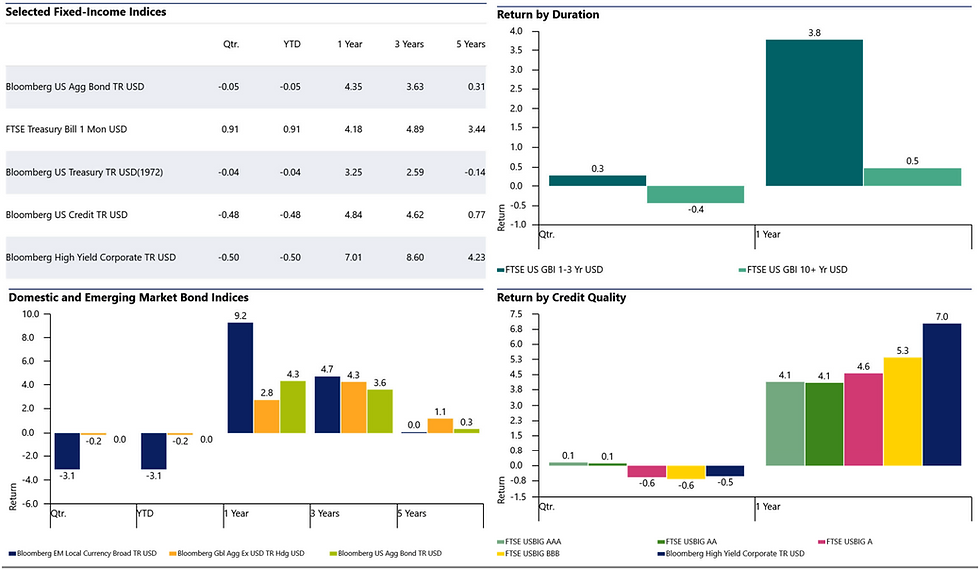
Performance - Fixed-Income


Q1 offered little relief for bond investors. Broad fixed income markets were essentially flat to slightly negative, with credit and high yield modestly trailing, while short-duration instruments quietly held their ground.


Longer-duration bonds continued to struggle as rates remained stubbornly elevated. The only reason one-year returns still look respectable is due to the two FOMC rate cuts providing a temporary boost.


Bottom line: bonds remain a difficult asset class - less risk than equities, but far from the risk reducer they once were.


Performance - Real Assets


So-called “alternatives light” delivered a mixed but telling quarter. Commodities did what they tend to do - surprise to the upside - posting strong gains thanks to the Iran conflict, while infrastructure held steady and hedge fund strategies quietly produced modest positive returns.


Real estate, however, continued to lag under the weight of high correlations to stocks. These are not home runs - they’re stabilizers.


Bottom line: liquid alternatives, with all their limitations, continue to quietly earn their seat at the table.


Copyright © Consilium, LLC. Commentary and opinions herein consist of subjective judgments and are subject to change without notice, as are statements of economics, investments, and financial markets. Information provided is believed to be reliable but does not warrant its accuracy or completeness. This material is not intended as an offer or solicitation for the purchase or sale of any financial instrument, security, or financial advisory service. The views and strategies described may not be suitable for all investors. This material has been prepared for informational purposes only, and is not intended to provide for, accounting, legal, investment or tax advice. Investing may involve a greater degree of risk and increased volatility than readers of this publication may be aware of or comfortable with. Past performance does not equate to future results. Consilium, LLC - Registered Investment Advisor. 

bottom of page